 NOAA - General products include the baseline reflectivity and velocity, and also algorithmic graphic products spectrum width, vertical integrated liquid, and VAD wind profile.
Products BR BV SRV SW ET VIL OHP STP ZDR CC KDP HCA DOD DSD
Storm Identification Az/Ran TVS Meso Posh Poh Size VIL VILD DBZM Hgt Top Fcst Mvmt
Storm Attribute IconsSummary
BR Base Reflectivity detect precipitation
BV Base Velocity wind either toward or away from the radar
SRV Storm Relative Velocity wind as if the storms were stationary
OHP One Hour Precipitation
STP Storm Total Precipitation
SW Spectrum Width
ET Echo Tops
VIL Vertically Integrated Liquid
ZDR Differential Reflectivity
CC Correlation Coefficient
KDP Specific Differential Phase
HCA Hydrometeor Classification Algorithm
DOD One Hour Difference
DSD Storm Total Difference
Az/Ran direction the cell is from the radar in degrees.
TVS Tornado Vortex Signature - tornadic potential
Meso mesocyclone is a rotation of strong thunderstorm, tornado
Posh probability of severe hail
Poh probability of hail
Size diameter of hail falling
VIL Vertically Integrated Liquid column. identify storms with heavy rainfall and large hail
VILD Vertically Integrated Liquid Density.quickly identifying thunderstorms
DBZMax highest reflectivity found within a particular thunderstorm cell.
Hgt vertical height of the maximum reflectivity (dBZ) for a certain thunderstorm cell.
Top highest vertical height of a 30 dBZ echo
Fcst Mvmt direction the movement is from/ speed, in knots
SMW - Special Marine Warning
FFW - Flash Flood Warning
SVR - Severe Thunderstorm Warning
TOR - Tornado Warning
TORR - Tornado Warning with tornado observed
TORE - Tornado Warning with tornado emergency
There are 14 GRLevel3 2.00 Radar Product categories:
| BR | Base Reflectivity | Reflectivity is one of the fundamental radar products Link This is a display of echo intensity (reflectivity) measured in dBZ (decibels of Z, where Z represents the energy reflected back to the radar). "Reflectivity" is the amount of transmitted power returned to the radar receiver. This product is used to detect precipitation, evaluate storm structure, locate boundaries and determine hail potential. |
| BV | Base Velocity | Base Velocity is a fundamental Doppler radar product Link A measure of the radial component of the wind either toward the radar (negative values) or away from the radar (positive values). Negative values are represented by cool colors (green) while positive values are represented by warm colors (red). This product is used to estimate wind speed and direction, locate boundaries, locate severe weather signatures and identify suspected areas of turbulence. |
| SRV | Storm Relative Velocity | Base Velocity with the storm motion removed Link When the motion of storms are subtracted from the wind field, the result is a picture of the wind as if the storms were stationary. Color induces are the same as base velocity. Comparing the storm relative motion image with base velocity image helps identify the rotating storm. |
| SW | Spectrum Width | The amount of variability in the base velocity - A measure of velocity dispersion within the radar sample volume. The primary use of this product is to estimate turbulence associated with mesocyclones and boundaries. |
| ET | Echo Tops | Height of the 18 dbz reflectivity Link An image of the echo top heights color coded in user-defined increments. This product is used for a quick estimation of the most intense convection and higher echo tops, as an aid in identification of storm structure features and for pilot briefing purposes. |
| VIL | Vertically Integrated Liquid | Estimate of liquid in a vertical column of reflectivity Link Link The water content of a 2.2 X 2.2 nmi column of air which is color coded and plotted on a 124 nmi map. This product is used as an effective hail indicator, to locate most significant storms and to identify areas of heavy rainfall. |
| OHP | One Hour Precipitation | Estimate of how much rain has fallen in one hour Link Definition: The One Hour Accumulation product provides a dual-pol estimate of how much rain has fallen over the past hour, updated each radar volume scan. A bias can be applied to this product to attempt to improve output. It is comparable to the DAA, which does not provide bias correction. It is analogous to the pre-dual pol product OHP. This is an image of estimated one-hour precipitation accumulation on a 1.1 nm by 1 degree grid. This product is used to assess rainfall intensities for flash flood warnings, urban flood statements and special weather statements. The maximum range of this product is 124 nm (about 143 miles) from the radar location. This product will not display accumulated precipitation more distant than 124 nm, even though precipitation may be occurring at greater distances. To determine accumulated precipitation at greater distances you should link to an adjacent radar. |
| STP | Storm Total Precipitation | Estimate of how much rain has fallen in an entire event Link Definition: The Storm Total Accumulation product provides a dual-pol estimate of how much rain has fallen over the past hour, updated each radar volume scan. A bias can be applied to this product to attempt to improve output. It is comparable to the DSA product, but STA is a lower-resolution product, which makes it analogous to the pre-dual pol product STP. This image is of estimated accumulated rainfall, continuously updated, since the last one-hour break in precipitation. This product is used to locate flood potential over urban or rural areas, estimate total basin runoff and provide rainfall accumulations for the duration of the event.
|
| ZDR | Differential Reflectivity | Dual Pol product comparing the horizontal and vertical reflectivity Link Definition: Differential Reflectivity is the logarithm ratio of the horizontally polarized reflectivity to the vertically polarized reflectivity. Positive values of ZDR indicate that dominant hydrometeors are larger in the horizontal than in the vertical. Negative values indicate dominant hydrometeors are larger in the vertical than the horizontal. Values near zero indicate that hydrometeors are similar in size in the vertical and horizonatal. |
| CC | Correlation Coefficient | Dual Pol product measuring the variability of echoes - Definition: Correlation coefficient (also referred to as ρhv or rho) provides a measure of the consistency of the shapes and sizes of targets within the radar beam. A higher value shows a higher consistency in the size and shape of radar targets, while a lower value indicates greater variability in shapes and sizes. It is important to note, however, that there are cases in which hail may not be indicated on the Differential Reflectivity. Suppose, for example, that hail is falling in a core of heavy rain. If there is more rain than hail, this will mask the hail by causing an increase in the Differential Reflectivity, essentially masking the hail. In order to discriminate hail versus rain in these cases, we use the Correlation Coefficient. The Correlation Coefficient essentially describes how much variability there is in what the radar beam is observing; the lower the Correlation Coefficient, the more variability. Rain usually has a Correlation Coefficient close to 1. If hail is added into the mix, the Correlation Coefficient will typically be between .9 and .95. Dual Polarization technology allows us the ability to discriminate rain versus hail. Using Differential Reflectivity, in conjunction with Correlation Coefficient, can help identify with certainty the areas of hail. This can help reduce property damage and increase safety for others.
|
| KDP | Specific Differential Phase | Dual Pol product measuring liquid content in echoes - Definition: Specific Differential Phase is a derived product that shows the gradient, or change, in Differential Phase Shift (ΦDP). Positive KDP values indicate greater phase shift in the horizontal than the vertical. A measurement of difference between the horizontal and vertical pulses phase changes as they travel through the atmosphere. Interpreting Specific Differential Phase (KDP) can be very difficult. It's primary use involves detecting areas of heavy rain. KDP values are largest when going through areas dominated by large rain drops. In some cases, regions with high KDP values may also contain melting hail. The four lowest elevation angles are available. |
| HCA | Hydrometeor Classification Algorithm | Dual Pol product estimating the type of echoes - Definition: The HC product attempts to provide a representation of radar echo types (out of 10 possible echoes - biological, clutter, ice crystals, dry snow, west snow, rain, heavy rain, big drops, graupel, and hail) in each radar range bin. It uses information from the base reflectivity, ZDR, CC, KDP, base velocity, and ΦDP products to make each determination. |
| DOD | One Hour Difference | Dual Pol product showing the difference between Dual Pol and legacy algorithms for One Hour Precipitation - Definition: The Digital One-hour Difference product shows the difference between the dual-pol DAA one-hour precipitation accumulation product and the legacy OHP precipitation accumulation product. Bias cannot be applied to this product. |
| DSD | Storm Total Difference | Dual Pol product showing the difference between Dual Pol and legacy algorithms for Storm Total Precipitation - Definition: The Digital Storm-total Difference product shows the difference between the dual-pol DSA storm-total precipitation accumulation product and the legacy STP precipitation accumulation product. Bias cannot be applied to this product. There are two difference products to help compare legacy precip products to dual-pol precip products. They are: Digital One-hour Difference (DOD) and Digital Storm-total Difference (DSD). DOD is the difference between dual-pol and legacy one hour accumulations while DSD is the difference between dual-pol and legacy storm total accumulations. Both difference products represent the dual-pol minus the legacy accumulations. These differences are taken with no bias applied. |
1 knot = 1.151 mph The distance between concentric range rings is 25 nm
NOAA - General products include the baseline reflectivity and velocity, and also algorithmic graphic products spectrum width, vertical integrated liquid, and VAD wind profile.
NOAA - Base Products
NOAA - Different types of radar images
A Glossary and Primer of Weather Terms used in National Weather Service Forecast Discussions
NWS Forecast Discussion Jargon Helpful Definitions by Jeff Haby (A Met. teacher with a large website)
Radar FAQs by Jeff Haby
Weather Calculators - Temp, wind speed, relative humidity, pressure, heat index, wind chill
Best training instruction manual(Fort Hood)
Guide using Version 1
Student Guide (PDF)
Tutorial using GRLevel3 Version 1.74(PDF)
YouTube Videos on GRLevel3
by Mark Grimes
by Zachary Burns Part 1
Part 2
Part 3
Part 4
Part 5
GRLevelX Trial Support Forums GRLevelX.com Owner Support Forums I sign in using roboform
Historical Data
To get historical data go to http://has.ncdc.noaa.gov/pls/plhas/has.dsselect and select
NEXRAD Level III then select the station and day(s) you want.
Download the command line utility program named NCDCtoRV3: http://www.grlevelx.com/downloads/ncdctorv3.exe
Place it on your Windows path or in the directory that you'll use for keeping your archived data.
Start a Windows command line session. Select Start->Run, type in "cmd", hit enter. Change to the directory containing the NCDC archive file.
Run the program and give it the name of the NCDC archive file, eg. "ncdctorv3 7000KFFC20080104.tar.z".
You'll end up with over one hundred individual .rv3 files, one for each radar volume in the archive. Simply drag and drop those rv3 files on GRLevel3 to view them.
Setup: Start archiving, choose site, smoothing, base reflectivity 0.5, storm attributes, warnings, windows/show warnings, GIS show everything but counties (when zoomed out), right click to choose home.
The National Weather Service radar assigns each thunderstorm that develops or moves into the range of a particular site, within the composite reflectivity product, a tracking code. This code consists of one letter followed by one number, such as in X1. Use this code to locate the cell on the radar.
The reason some of the characteristics may be different pertains to the vertical level at which the storm was scanned, which depends on the cell's distance from the radar. Best imagery is usually taken close to a radar site, but not above it, allowing for all of the beams sent by the radar to reflect off the cell.
Any given thunderstorm may or may not retain the cell identification code between radar scans. This is largely dependent on how consistent the storm is, by means of development and growth, between runs. If the radar believes a new cell has formed, it will identify it with a new tracking code, even though it may have been a detected storm in previous runs that changed structure. Two tracking codes could be assigned to one storm if it appears to the radar that the cell is splitting into two new storms. A linear squall line or bow/comma echo usually has several identification codes.
A thunderstorm that is very near or above the radar site may not be detected because the radar's beams are unable to tilt at such an angle. A cell identification code will likely not be assigned to such a cell, which will tend to have poor and inaccurate reflectivity. Even cells that had a tracking code at one point may lose them.
Az/Ran TVS Meso Posh Poh Size VIL VILD DBZM Hgt Top Fcst Mvmt
Az/Ran
This storm attribute helps to locate a certain cell on the radar's composite reflectivity product.
Az, which is short for azimuth, tells the direction the cell is from the radar in degrees. For example, an az, or azimuth, of 180 degrees means that a particular storm is directly south of the radar site.
Ran tells the distance that a cell is from the radar in nautical miles. For example, on a 124 nautical mile sweep, a cell with a ran of 62 would appear exactly between the radar site and the perimeter of the radar sweep.
The "Az/Ran" of each detected storm is plotted on the radar image, if desired by the radar operator, with the cell identification code just beneath it, and the projected path of the storm ahead of it.
TVS
The abbreviation TVS stands for Tornado Vortex Signature. One of three terms will be used to describe the tornadic potential of a certain cell in this column.
NONE – The potential for a tornado is not existent according to the radar when NONE is shown. That does not necessarily mean that a tornado is not present, given tornadoes can sometimes form starting at the ground, and make their way up. Always heed National Weather Service warnings first.
ETVS – "Elevated Tornado Vortex Signature" – Circulation does not extend all the way to the lowest tilt on radar with an ETVS, but is strong among the other tilts. An ETVS should be monitored closely for development into a TVS.
TVS – If a TVS is identified by radar, a tornado is a good possibility, because circulation has been detected through the lowest possible tilt. However, since the radar beam does not pan all the way down to the surface, there is no way to guarantee this. Listen to local media to find out more information or see if storm spotters have confirmed the feature.
Remember that a radar cannot scan the ground to look for a tornadic rotation, which can lead to detection errors. The radar only obtains data from the storm tower, and relies heavily on this to detect a tornado vortex signature.
Since the algorithm which detects the tornadic, or tornado, vortex signature is sensitive, false signatures can at times be detected along frontal boundaries and squall lines, or where a definite wind shift is present, especially when the front edge of a squall line is parallel to the radar beam. A TVS or ETVS does not guarantee a tornado.
When a TVS or ETVS is detected, the radar has found an area of intense and concentrated rotation, more so than a mesocyclone. Watch this for persistence. Other algorithm criteria, such as the strength and vertical depth, must also be met for a radar to indicate a tornado vortex signature.
A TVS or ETVS itself is not a visually observable feature. The possible tornado that could accompany such a signature obviously is visible however.
A radar cannot detect a tornado vortex signature well, or possibly at all, if a thunderstorm is close to the radar site. Beams are unable to extend into the updraft at such a degree from the radar's transmitter. A lesser, or possibly absent, tornado vortex signature is displayed as a result.
Do not question warnings issued by the expert National Weather Service meteorologists. If you feel your life is threatened by a thunderstorm, do not postpone seeking shelter, even if a warning is not in effect for your area.
MESO
The term MESO is short for mesocyclone, which is generally a radar term. A mesocyclone is a rotation found within the tower of a strong thunderstorm, and can sometimes lead to the formation of a tornado, or a tornado vortex signature on radar.
When a radar detects a mesocyclone, it is good practice to watch for time continuity between volume scans, a diameter of two to six miles, and an extension vertically of over 10,000 feet. These characteristics can only be found in velocity imagery. Nonetheless, the mesocyclone algorithm is fairly good at making sure all of the needed criteria are roughly met. One thing that can be watched from composite reflectivity is the time period at which a mesocyclone is present. The longer the period at which a rotation is sustained within the head of a storm, the better chance there is a mesocyclone is active within that given cell.
One of four key words can be found within the MESO column of the storm attribute table.
NONE – A mesocyclone is likely not present. Since the radar, through several tilts, can penetrate many layers where a mesocyclone resides in a thunderstorm, it is unlikely that a mesocyclone will go undetected.
UNCO – "Uncorrelated Shear" – A weak and insignificant mesocyclone may be present. Given the sensitivity of the algorithm used for detecting mesocyclones, there is a possibility that minimal rotation within the cloud needed for a future severe thunderstorm is not even present. Rotation is found in only one radar slice vertically.
3DCO – "3D Correlated Shear" – A moderate mesocyclone is possible, and some inner-cloud rotation has been detected on at least two radar slices vertically. A 3DCO needs to be watched for persistence and growth.
MESO – Well-developed rotation has been detected on at three or more radar slices for the full mesocyclone indication. The thunderstorm it is attributed to may be severe given the mesocyclone is persistent.
Since the algorithm which detects mesocyclones is sensitive, false mesocyclones can at times be detected along frontal boundaries and squall lines, or where a definite wind shift is present, especially when the front edge of a squall line is parallel to the radar beam. Therefore, a mesocyclone on radar is not always an indication a storm is severe.
Radars can also sometimes falsely detect a mesocyclone if a thunderstorm is directly over a radar site. On the flip side of that, a radar cannot detect mesocyclones well, or possibly at all, if a thunderstorm is close to the radar's transmitter. Beams are unable to extend into the updraft at such a degree from the radar site. A lesser, or possibly absent, mesocyclone classification is displayed as a result.
Mesocyclones should not be considered a formation that is viewable, as tornadoes are. Some cloud features may suggest that a mesocyclone is present in a thunderstorm, such as curved feeder or inflow bands.
POSH and POH
The probability of severe hail, which is hail over three-quarter inch in diameter, is known as POSH, and is displayed as a percentage within the POSH column on the storm attribute table.
The probability of hail, which could be any size, is known is POH, and is also displayed as a percentage on the storm attribute table.
Both POSH and POH are determined for each thunderstorm on radar as a whole, given they have a cell identification code.
Cells a great distance from the radar site, as well as those which have just developed, may have an unknown, or undetectable, probability. Check the next scan as to if the unknown probability has been resolved, as it may. If not, try using a different radar site that the storm cell may be closer to. Thunderstorm cells that have an unknown probability also have an unknown maximum hail size. Either all hailstone-related information is present, or none of it is.
Hail algorithms are basic given the radar is supplied with the height of the freezing level (0° C) and the placement of the -20° C layer in the atmosphere. Therefore, the hail probabilities and estimates can be misinterpreted by a user who does not have a great deal of experience.
Different atmospheric conditions can alter the size of hail. As a result, radar operators sometimes have their own techniques to determine hailstone size and probabilities.
Look for the largest hailstones and best chances of it under areas of high reflectivity on the composite radar scan.
A radar cannot detect the probability of general hail and severe hail well, or possibly at all, if a thunderstorm is close to the radar site. Beams are unable to extend into the updraft at such a degree from the radar's transmitter.
Max Size
Radar also tries to determine the maximum diameter of hail falling within a storm cell. The output from this is formatted into inches and placed in the "Max Size" column of the storm attribute table.
The size that is estimated by radar is usually overdone and the majority of hail that falls is generally smaller. This is especially true during the summer months. Therefore, National Weather Service radar operators tend to only use the maximum hail size to issue warnings when the probability of severe hail (POSH) is over 50%.
Radar hailstone estimates range from <.50 inch to >4.00 inches in diameter by quarter (.25) increments.
Cells a great distance from the radar site, as well as those which have just developed, may have an unknown, or undetectable, hail size. Check the next scan as to if the unknown size has been resolved, as it may have. If not, try using a different radar site that the storm cell may be closer to. If a maximum hailstone size is not detectable, or unknown, the probabilities of hail and severe hail will not be undetectable as well.
A radar cannot detect the maximum size of hail well, or possibly at all, if a thunderstorm is close to the radar site. Beams are unable to extend into the updraft at such a degree from the radar's transmitter.
With that said, it is also possible for storms to weaken. Therefore, it is a good practice to check the atmospheric conditions before judging that the "cone of silence" is responsible for the weakening maximum hailstone sizes.
Never question the decision of an expert meteorologist to issue or withhold a warning.
VIL
VIL is an abbreviation for Vertically Integrated Liquid.
Unlike the VIL product, which determines vertically integrated liquid using grid boxes (also known as grid-based VIL), the VIL number used on the storm attribute table is cell-based. This allows for the vertically integrated liquid associated with composite reflectivity to read slightly higher than that of the VIL product, especially when a thunderstorm is tilted highly.
The reason for the difference is the way the reading is taken. With cell-based VIL, the radar's elevation scans slice the storm nearly horizontally, searching for the highest possible reading. With grid-based VIL, however, the radar's measurements are made in vertical grid VIL boxes. Therefore, with grid-based VIL, the highest levels of vertically integrated liquid are more apt to being overlooked.
Either way, vertically integrated liquid is the amount of liquid in a vertical column. The output is displayed in kilograms per square meter.
Radar operators often use VIL to identify storms with heavy rainfall and large hail. It can also be used to predict the onset of wind damage if it is combined with other products.
There is not a set VIL number which determines when storms are capable of producing large hail. The reason for this is due to the freezing level in the atmosphere and the height of the updraft. In general, the layer of freezing can be found higher in the atmosphere during summer, and lower, possibly at the surface, during winter. The lower the freezing layer is in the updraft, the better chance there is that hail can be expected to fall on the surface. As the freezing layer becomes higher in the atmosphere, a larger updraft tower is required for hail, and therefore a heavy rain event is more likely to occur.
A frontal boundary, such as a cold front, can also have an affect on how VIL numbers correlate to the size of hail. Behind a front, when cold air is aloft, a VIL of 10 to 25 is sufficient to sustain nickel-sized hail. However, warm air aloft in front of a cold front can cause storms with a VIL of 25 to 40 to only drop dime-sized hail.
During the summer, depending on your location, a high vertically integrated liquid number, one that favors heavy rainfall or large hail, is usually between 50 and 65. This number is typically less during the winter months.
A radar cannot detect vertically integrated liquid well, or possibly at all, if a thunderstorm is close to the radar site. Beams are unable to extend into the updraft at such a degree from the radar's transmitter.
VILD
VILD is an abbreviation for Vertically Integrated Liquid Density.
VIL Density is simply the VIL divided by the echo top (m) and multiplied by 1000 in order to express the result as g m-3. The importance of VIL Density is its use in quickly identifying thunderstorms with high reflectivities relative to their height. Such thunderstorms often contain hail cores, and as VIL Density increases, the hail core tends to be deeper, more intense, and the resulting hail sizes tend to be larger.
dBZ Max
The dBZ Max on the storm attribute table is the highest reflectivity found within a particular thunderstorm cell. Depending on the reflectivity, a radar operator can determine the rate at which rain is falling as well as the potential for severe hail.
Rain starts to fall when the reflectivity (dBZ) is around 20. Of course, a set of atmospheric conditions can alter this. A very moist and saturated environment could allow rain or drizzle at a lesser reflectivity level. However, a dry environment could allow rain to reach the surface only at a higher reflectivity, as some of the precipitation could evaporate before it hits the ground.
Snow falls at much lower reflectivity levels. The radar will likely not tag even a band of heavy snow, unless it is associated with convection, creating thundersnow, for the storm attribute table. In general, snow reflectivities are less than 30 dBZ.
A reflectivity (dBZ) of around 55 may suggest large hail is falling, but not always. For a better indication as to if hail is falling with a storm, compare the freezing level in the atmosphere to the size of the updraft tower. The lower the freezing level intersects with the updraft, the better chance there is of hail, given the updraft tower has been sustained. Referring to the vertically integrated liquid, or VIL, may also be a good idea.
On the radar image, one indication of rather large hail with a cell is a hail spike. A hail spike is shown extending radially outward from a radar site (pointing the opposite direction) when the radar beam crosses through the core of a thunderstorm.
A radar cannot detect the maximum reflectivity (dBZ) well, or possibly at all, if a thunderstorm is close to the radar site. Beams are unable to extend into the updraft at such a degree from the radar's transmitter.
The vertical height of the maximum reflectivity (dBZ) can also be determined.
Height
The height column in the storm attribute table corresponds to the vertical height of the maximum reflectivity (dBZ) for a certain thunderstorm cell. The output should normally be a four-digit or five-digit number displayed in feet above radar level (ARL).
The National Weather Service radars originally display a height in composite reflectivity as a one-digit or two-digit number with a one-digit decimal. Multiply this number by one thousand to correctly format the output. For example, if a radar displays the height as 15.6, the actual height is 15,600.
Radar operators use the reflectivity height to determine the structure of a thunderstorm, and where the most intense portion of the updraft is. The reflectivity height may also be combined with other products to form an algorithm regarding the potential for damaging downburst winds. Those in the aviation industry may also find the height of the maximum dBZ useful so pilots can avoid flying planes into extreme turbulence. In general though, aviators attempt to avoid strong and severe thunderstorms, as well as give them a decent amount of room.
A radar cannot detect the maximum reflectivity (dBZ) height well, or possibly at all, if a thunderstorm is close to the radar site. Beams are unable to extend into the updraft at such a degree from the radar's transmitter.
Top
The top column in the storm attribute table corresponds to the highest vertical height of a 30 dBZ echo for a certain thunderstorm cell.
The National Weather Service radars originally display a height in composite reflectivity as a one-digit or two-digit number with a one-digit decimal. Multiply this number by one thousand to correctly format the output. For example, if a radar displays the height as 15.6, the actual height is 15,600.
Depending on the distance from the radar site, and the tilt of the beams, the echo top can be greatly overestimated or underestimated to the order of five thousand to ten thousand feet.
The radar may not always be able to resolve the 30 dBZ echo top. When this error occurs, the output reading will have a "<" or ">" in front of it, meaning the top is less than or greater than, respectively, the number that follows. For example, if the reading <26.8 is shown, then the top is less than 26,800 feet.
The storm attribute table's top column does not produce the same readings that are on the "Echo Tops" product because the product is not reliant on the 30 dBZ echo, but the column's output is. In addition, the product is generally less precise than the column. The reason for this lies on the fact that the algorithm associated with the "Echo Tops" product measures the echo top with the radar beam that is closest to it. At far distances, it can appear on the product that the height of the clouds sharply varies between two levels five thousand feet apart, whereas the variance between tops is more gradual.
A radar cannot detect the highest vertical 30 dBZ height well if a thunderstorm is close to the radar site. Beams are unable to extend into the updraft at such a degree from the radar's transmitter.
Fcst Mvmt
This column on the storm attribute table lists the forecasted movement of each thunderstorm cell. On the radar image itself, a projected path is displayed starting at the cell identification code, and extending outward.
The forecasted movement of any given thunderstorm cell is separated into two parts within the column. On the left, the first part is the direction the movement is from, in degrees, which is inverse from where the storm is headed. On the right, the second part consists of the speed, in knots, at which the storm is moving. For an example, if the output of one thunderstorm in the "Fcst Mvmt" column was 270/33, the cell would be moving toward the east at 33 knots.
The movement is calculated from the centeroid of each storm cell, and uses each cell's history. A centeroid can be determined from the "Az/Ran" output, which is also plotted on the radar image, if desired by the user, and is the base of the projected path.
In the event that a storm cell has just developed, and is identified by radar, the word "New" may be displayed for the forecasted movement because not enough data is present for the radar's algorithm to detect where it is headed. Developing thunderstorms can often have unusual paths since the radar's algorithm sometimes misinterprets cell development as movement.
Squall lines may have several forecasted paths. With luck, they will all be moving at around the same pace in the same general direction. If not, take an average. It is a very good practice to take an average of the various speeds and directions coming from the different storm cells on radar. Thunderstorm cells that have been in existence the longest tend to have the best projected paths. Try to rule out any odd and abnormal paths if possible. Odd paths are often adjusted by the radar between runs to be more accurate. Be careful though, as cells moving in front of a squall line can often deviate from the movement of the line. This situation, along with several others, makes the job of radar operators difficult at times, especially when they are trying to issue advanced storm warnings. Nonetheless, always heed National Weather Service warnings, which are issued by experts, to seek shelter immediately.
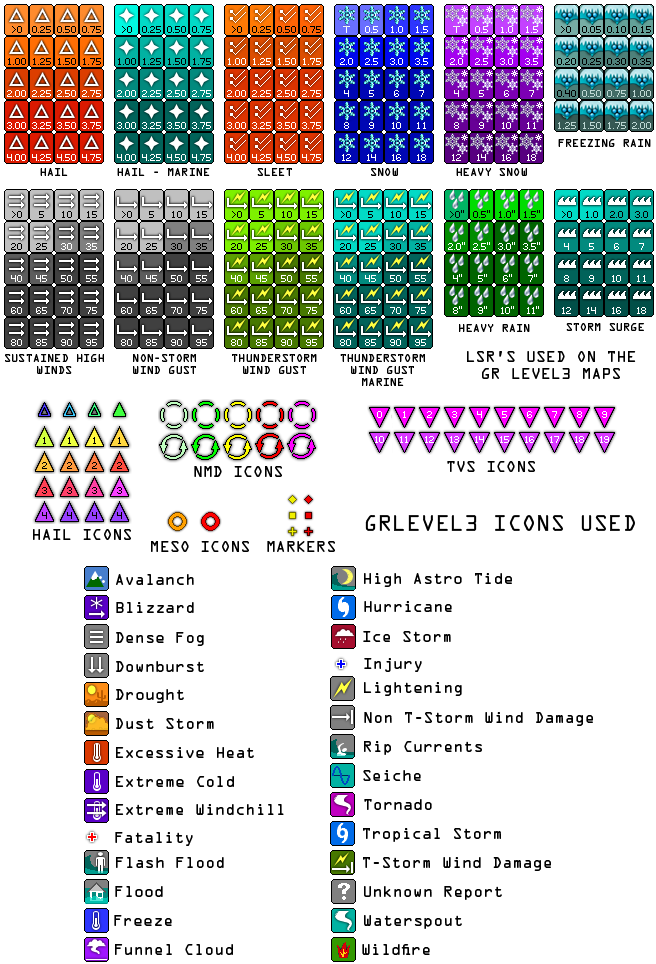
Storm Attributes are automatically downloaded and displayed on top of the radar data. There are Tornado Vortex Signature (TVS) icons, Elevated TVS icons (ETVS), New Mesocyclone Detection (NMD) icons, legacy Mesocyclone Detection (MESO) icons, and Hail Size icons.
|
|
TVS Icons - Tornado Vortex Signature The TVS iconsheet has two rows of ten icons. The icons represent the tens digit(s) of the TVS Low-Level Delta Velocity (LLDV) in knots. For example, the "19" icon indicates that LLDV was at least 190 kts.
|
|
|
ETVS Default Icon - Elevated Tornado Vortex Signature
|
|
|
NMD Icons - New Mesocyclone Detection The NMD iconsheet has two rows of five icons. The top row is shown when the mesocyclone does not extend down to the lowest velocity tilt. The NMD Strength Rank is used to select the column via the equation: (SR-1)/2.
|
|
|
MESO Icons - Mesocyclone Detection The MESO iconsheet is shown on legacy volume scans. There are two icons: 2D detection and 3D detection.
|
|
|
Hail Icons The Hail iconsheet has five rows of four icons. Each row corresponds to the inches in the estimated hail size. Each column represents 0.25" increments. |
The following reports review how accurate forecasts are:
Forecast_Accuracy_For_Dec_2011_For_San_Francisco_WeatherSpark.pdf
Internet_Weather_Forecast_Accuracy_OmniNerd.pdf
j_d_eggleston_how_valid_tv_forecasts.pdf
WeatherForecasts_How_Reliable_EN.pdf