|
|

|
|
Customers(meters): Total retail sales: Total generation: Revenue: Avg. residential price: Avg. industrial price: |
1,077,024 36,950 GWH 44,180 GWH $2.399 billion 8.8 cent/kWh 5.1 cent/kWh |
| Total Emissions | Fossil Rate | Total Rate | ||||
| Tons | Rank | lb/MWH | Rank | lb/MWH | Rank | |
| NOx | 108,301 | 12 | 9.22 | 7 | 4.91 | 17 |
| SO2 | 165,034 | 17 | 14.05 | 23 | 7.48 | 28 |
| CO2 | 26.6 mill. | 18 | 2,266 | 16 | 1,207 | 39 |
Generating Fuel Mix


| EMISSIONS (TONS) | EMISSION RATES (LBS/MWH)** | GENERATION (MWH) | ||||||||
| PLANT NAME | %OWN | NOx | SO2 | CO2 | NOx | SO2 | CO2 | COAL | OIL | GAS |
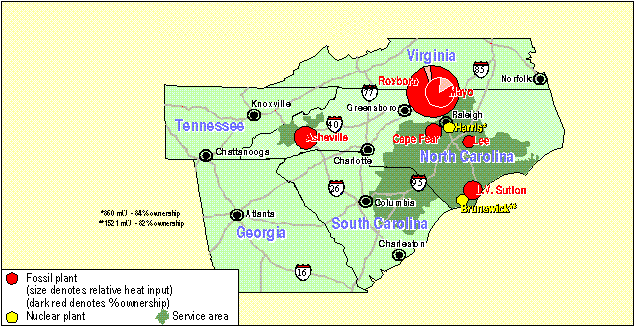
| ASHEVILLE | 100 | 14,323 | 22,357 | 2,939,767 | 10.98 | 17.14 | 2,253 | 2,605,932 | 3,204 | - |
| CAPE FEAR | 100 | 5,171 | 12,304 | 1,599,350 | 6.64 | 15.79 | 2,052 | 1,555,573 | 2,905 | - |
| H B ROBINSON | 100 | 2,733 | 8,637 | 891,487 | 7.26 | 22.93 | 2,367 | 751,546 | 1,775 | - |
| L V SUTTON | 100 | 10,302 | 14,201 | 1,971,796 | 12.17 | 16.78 | 2,329 | 1,684,371 | 8,542 | - |
| LEE | 100 | 4,437 | 6,654 | 994,751 | 10.28 | 15.42 | 2,306 | 855,760 | 7,077 | - |
| MAYO | 83.83 | 15,271 | 22,983 | 5,035,618 | 7.52 | 11.31 | 2,479 | 4,050,737 | 12,487 | - |
| ROXBORO | 96.25 | 59,545 | 82,454 | 14,220,431 | 9.27 | 12.84 | 2,214 | 12,817,937 | 29,135 | - |
| W H WEATHERSPOON | 100 | 1,221 | 2,252 | 313,653 | 9.72 | 17.93 | 2,498 | 250,011 | 1,150 | - |
**New source equivalent emission rates are:
Copyright 1997, Natural Resources Defense Council, Inc.
 Contact us at proinfo@nrdc.org